-
CO2 Depot: Nature!
Mehr Weniger anzeigenHumans have altered the Earth greatly and emitted lots of CO2 through land use change, but with good stewardship (restoration + conservation), we will be able to store lots of CO2 again in vegetation and soil.
In collaboration with the ETH Crowther Lab and the ETH science museum focusTerra, we will make the potential of nature-based CO2 storage understandable and explorable, while simultaneously calling for action.-
-
In this area you will find all information about the general conditions of the course.
-
-
Students / Groups
Lukman Ascic, Lea Bischoff, Mo Bünzli, Sonja Cowley, Benjamin Eggstein, Carina Good, Loïc Hommel, Nanthatchaporn Pree Janthasom, Tanja Landolt, Matilda Sutherland (Exchange Student), Audrey-Meret Lohmann, Lyvia Muniz Gomes Wägli, Matthias Naegeli, Luis Praxmarer, Elena Walther, Lars Ziegler- Group 01
Loïc, Carina, Liv - Group 02
Elena, Lars, PJ - Group 03
Tanja, Mo, Matthias - Group 04
Luis, Audrey, Sonja - Group 05
Lea, Matilda, Luke, Benjamin
- Group 01
-
Collaboration Partner
Thomas Lauber | thomas.c.lauber@gmail.com
Kerstin Bircher | kerstin.bircher@erdw.ethz.ch
Joanna Steigh | joanna.sleigh@hest.ethz.ch
-
Attendance
In the contact hours a minimum attendance of 80% is required to pass the course. Contact hours: kick-off, input session, mentoring and presentation. Studio visits are not mendotory. These are used to ask additional questions on request. Take advantage of this offer. -
Grading
Grades will be based on final presentation, final work and deliverables.
- 20% Presentations
- 50% Final work (Concept, GUI, Micro Interactions, Prototype)
- 30% Deliverables
- 20% Presentations
-
Deliverables
All deliverables have to be uploaded to the filer until Monday 12.12.2022 at 09:00 AM.
- PDF Documentation (to be stored in a file labelled “Documentation”)
- Mockup & screencast of interaction with the mockup. A short video (~2min) of the project (to be stored in a file labelled “Video”)
- Text file including the project title, a short description, and a project description (in a file to be labeled “Texts”)
- Approx. 10 representative images of the project (to be stored in a file labeled “Images"
Please take a look at the IAD documentation guidelines for submission.
-
Feedback
There will be a overall feedback after the final presentation. Individual feedback is given after the module has been handed in at a certain distance from the module. This date will be announced.
-
-
-
Topic
Nature-based solutions for CO2 storage
Humans have greatly altered the Earth, releasing much CO2 through land use changes while destroying natural storage capacity of CO2 from the atmosphere. If we take our ecological responsibility (by restoring and maintaining natural ecosystems - and not just by "planting trees") we can generate again a large amount of CO2 storage capacity in vegetation and soil.
Problem
Climate change and biodiversity can be overwhelming - there is a wealth of information and warnings. Creative people, such as artists and designers, have the opportunity to spread knowledge through creative projects. However, artists lack access to collaboration with scientists. Without dedicated collaboration, scientific data and findings are rarely put into a full context, leading to misinterpretation, misunderstanding and ultimately inaction
Aim
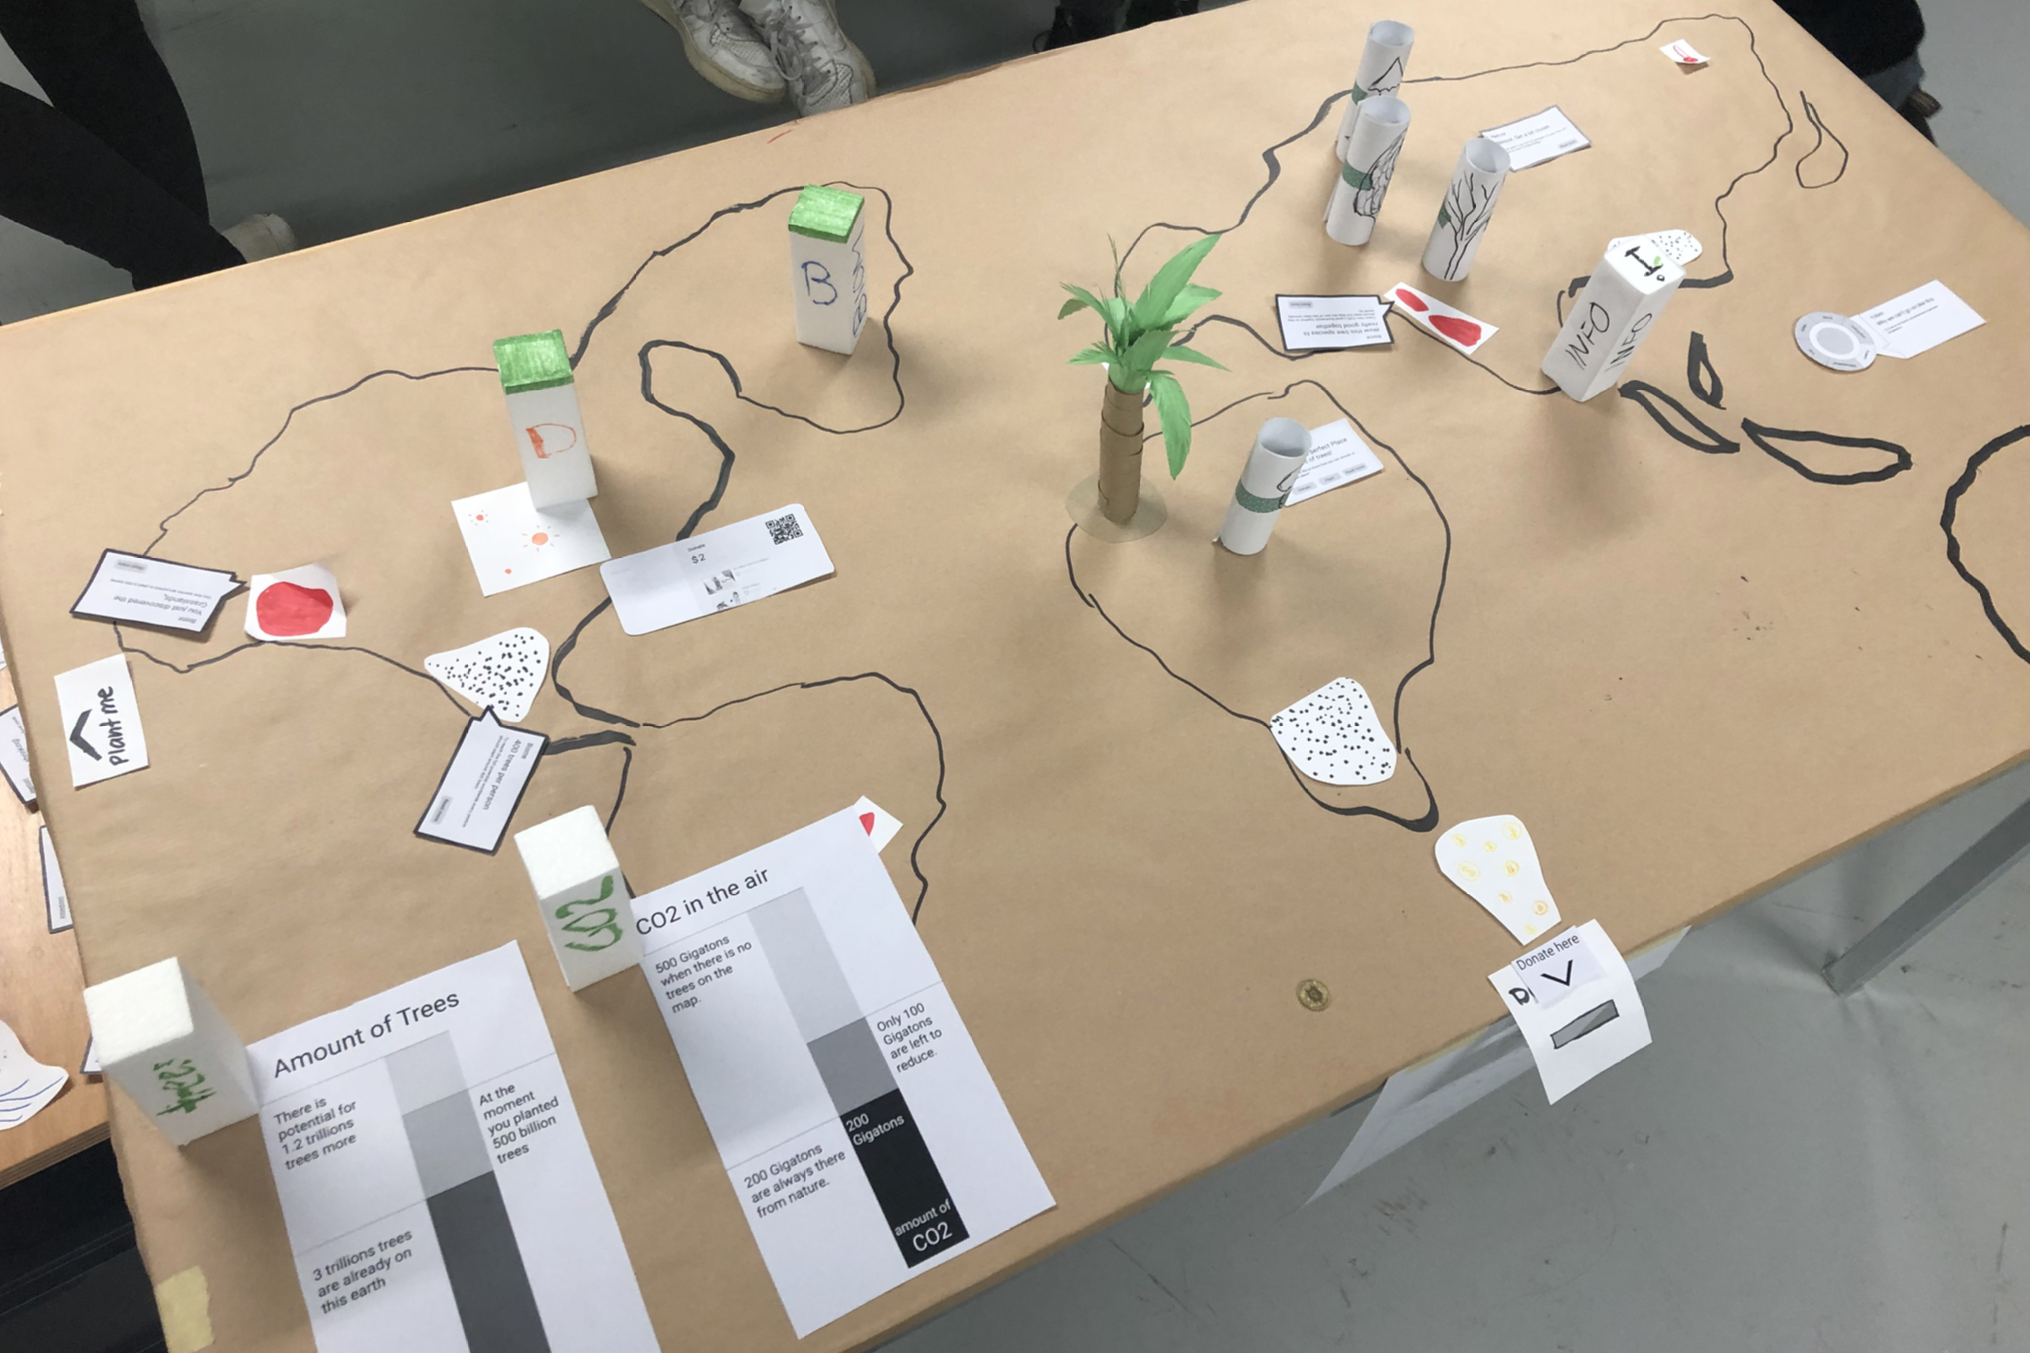
In collaboration with the ETH Crowther Lab and the ETH science museum focusTerra, we aim to create an "Interactive Mapping Table" where people can explore and learn about nature-based solutions for CO2 storage and climate data to create new understanding of ecosystems around the world and inspire change.Each team develops a concept for the multitouch-table based on the three parts "understand", "explore" and "act";
- understand - Understanding how we humans have changed the environment and the amount of CO2 that can be stored in natural systems
- explore - Exploring the Potential for CO2 storage lying in natural ecosystems - both above/at the earth's surface (vegetation) and below the earth's surface (in the soil).
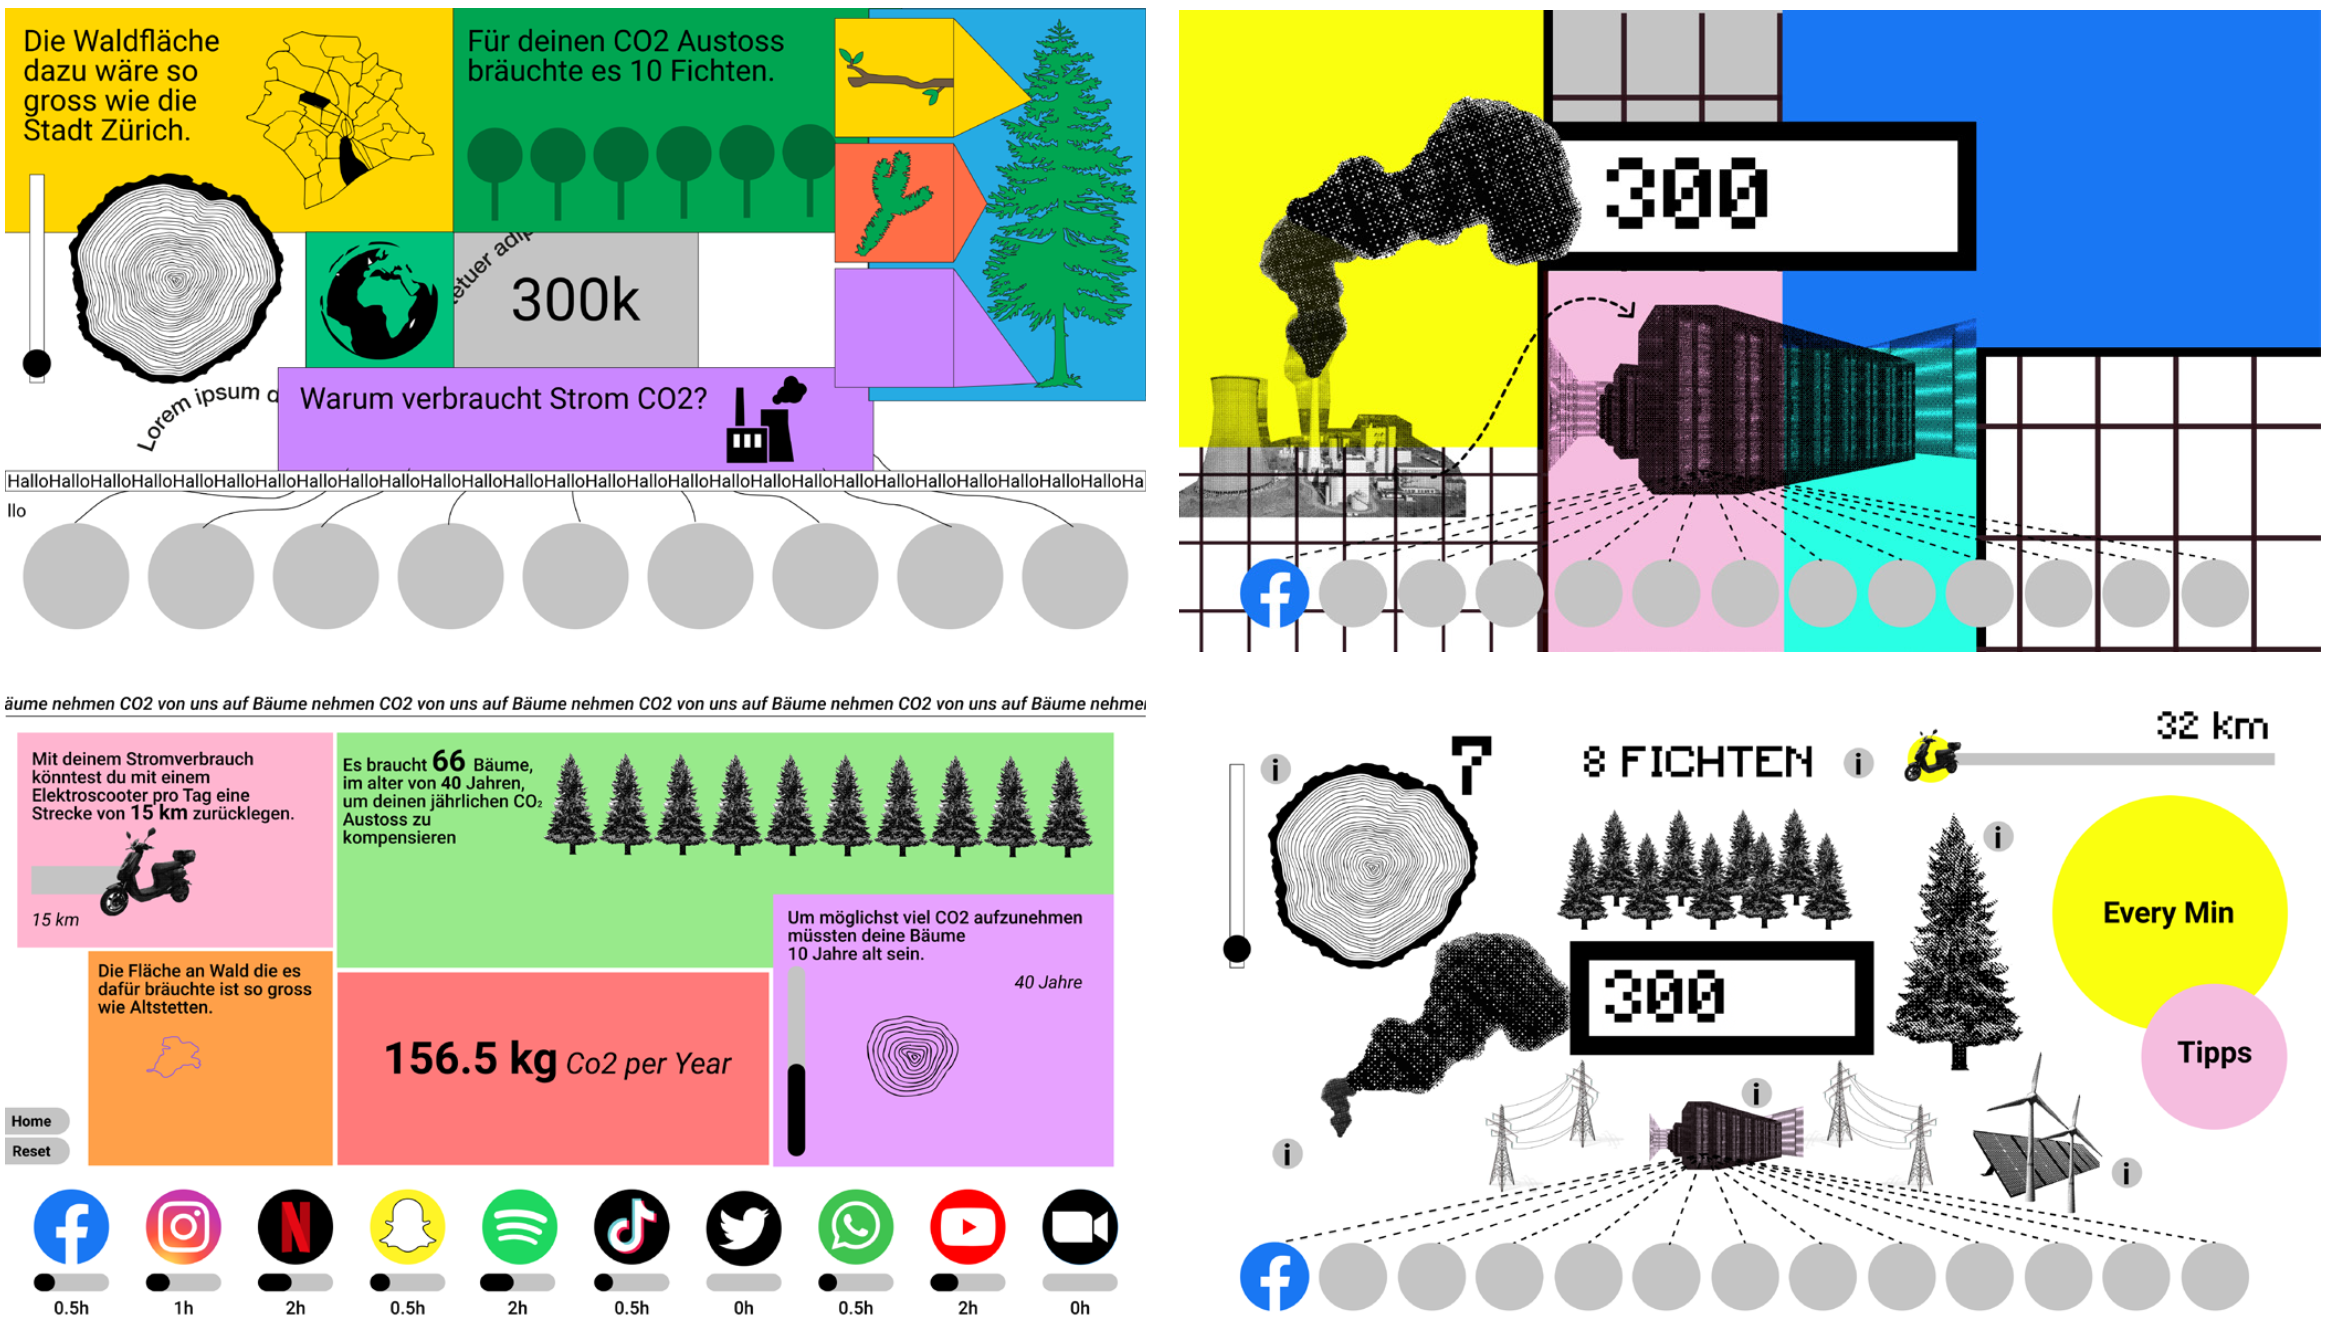
- act - Learning about the most effective actions that can be taken on earth to exploit the CO2 storage potential and being encouraged to do something yourself.
>>More detail description in the attached document.
The three parts each include different data, goals and correspondingly different visualization and interaction possibilities. Individual screen situations are designed via a click-through mockup, whereby the core screens with the important/exciting interactions via tokens are programmed. The tokens should be an integral part of the concept.
The prototypes will be shown as an exhibit with the Multitouch table in a planned special exhibition about CO2 in focusTerra, the E-arth & Science Discovery Center of ETH Zurich. The requirements for the prototype can be read in the following document.
Over the past years, scientists of the ETH Crowther Lab have already been working with IAD students from ZHdK to enhance scientific data by developing appropriate interactions and visualisations, a multi-touch display that allows regular 2D gestures, and several physical tokens for further interaction. Unlike any other format (e.g. film or VR), the interactive map format allows users to explore the spatial and temporal patterns in the data without being limited to a specific user journey.
-
Topic
Nature-based solutions for CO2 storage
Humans have greatly altered the Earth, releasing much CO2 through land use changes while destroying natural storage capacity of CO2 from the atmosphere. If we take our ecological responsibility (by restoring and maintaining natural ecosystems - and not just by "planting trees") we can generate again a large amount of CO2 storage capacity in vegetation and soil.
Problem
Climate change and biodiversity can be overwhelming - there is a wealth of information and warnings. Creative people, such as artists and designers, have the opportunity to spread knowledge through creative projects. However, artists lack access to collaboration with scientists. Without dedicated collaboration, scientific data and findings are rarely put into a full context, leading to misinterpretation, misunderstanding and ultimately inaction
Aim
In collaboration with the ETH Crowther Lab and the ETH science museum focusTerra, we aim to create an "Interactive Mapping Table" where people can explore and learn about nature-based solutions for CO2 storage and climate data to create new understanding of ecosystems around the world and inspire change.Each team develops a concept for the multitouch-table based on the three parts "understand", "explore" and "act";
- understand - Understanding how we humans have changed the environment and the amount of CO2 that can be stored in natural systems
- explore - Exploring the Potential for CO2 storage lying in natural ecosystems - both above/at the earth's surface (vegetation) and below the earth's surface (in the soil).
- act - Learning about the most effective actions that can be taken on earth to exploit the CO2 storage potential and being encouraged to do something yourself.
>>More detail description in the attached document.
The three parts each include different data, goals and correspondingly different visualization and interaction possibilities. Individual screen situations are designed via a click-through mockup, whereby the core screens with the important/exciting interactions via tokens are programmed. The tokens should be an integral part of the concept.
The prototypes will be shown as an exhibit with the Multitouch table in a planned special exhibition about CO2 in focusTerra, the E-arth & Science Discovery Center of ETH Zurich. The requirements for the prototype can be read in the following document.
Over the past years, scientists of the ETH Crowther Lab have already been working with IAD students from ZHdK to enhance scientific data by developing appropriate interactions and visualisations, a multi-touch display that allows regular 2D gestures, and several physical tokens for further interaction. Unlike any other format (e.g. film or VR), the interactive map format allows users to explore the spatial and temporal patterns in the data without being limited to a specific user journey.
-
-
-
-
-
Kick Off
- Introduction into the module "Data Visualization"
- Introduction into the collaboration by Thomas Lauber (Crowther Lab)
- Introduction into the module "Data Visualization"
-
-
Briefing Day Downloads
-
-
Material inspection
Go through the following material on Paul by Tuesday evening, 08.11.2022.
-
External Input: Modular Information Design with Nicole Lachenmeier - Superdot Studio
Room: Seminarroom 4.K16
Time: Wednesday 09th of November | 09:00 – 12:00 / 13:00 - 17:00The workshop "Modular Information Design" explores the use of data and design. Here, the approach of modular information design is introduced on the basis of a prepared data set. Using simple tools such as pen and paper, many visualization variants are designed. The results are evaluated in collective reflection sessions. Through the presentation of various information design projects by Superdot, students will learn about processes and tools.
Please bring fineliners in at least 3 different colors, ruler, at least 2 pastel luminous pencils and optional compass (Zirkel)
-
Visit current focusTerra Exhibition @ETH Zurich
Schedule:
13:45 – Meeting point: in front of Sonneggstrasse 5 in Zurich (focusTerra ETH)
14:00 – Onboard and welcoming
14:10 – Tour through current focusTerra exhibitions incl. earthquake simulator
15:00 – Break
15:15 – Presentation of planned CO2 exhibition / first exchange of ideas
16:00 – End
-
-
-
-
Mentorings Wednesday
Look at the calendar for your timeslot. If someone is unable to attend a meeting, please swap the timeslots among the class so that there are no gaps.
Expectation:
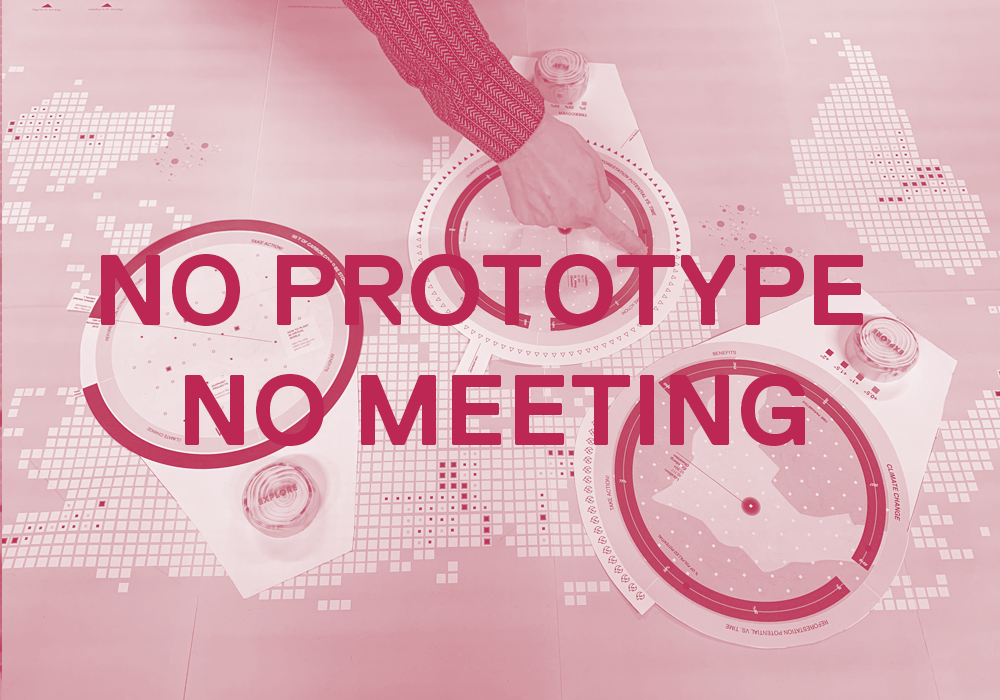
We expect concepts in the form of paper prototypes. Different approaches are desired. Think through all the three areas; understand, explore, act, and communicate them to us through the paper prototype. Please work in large format.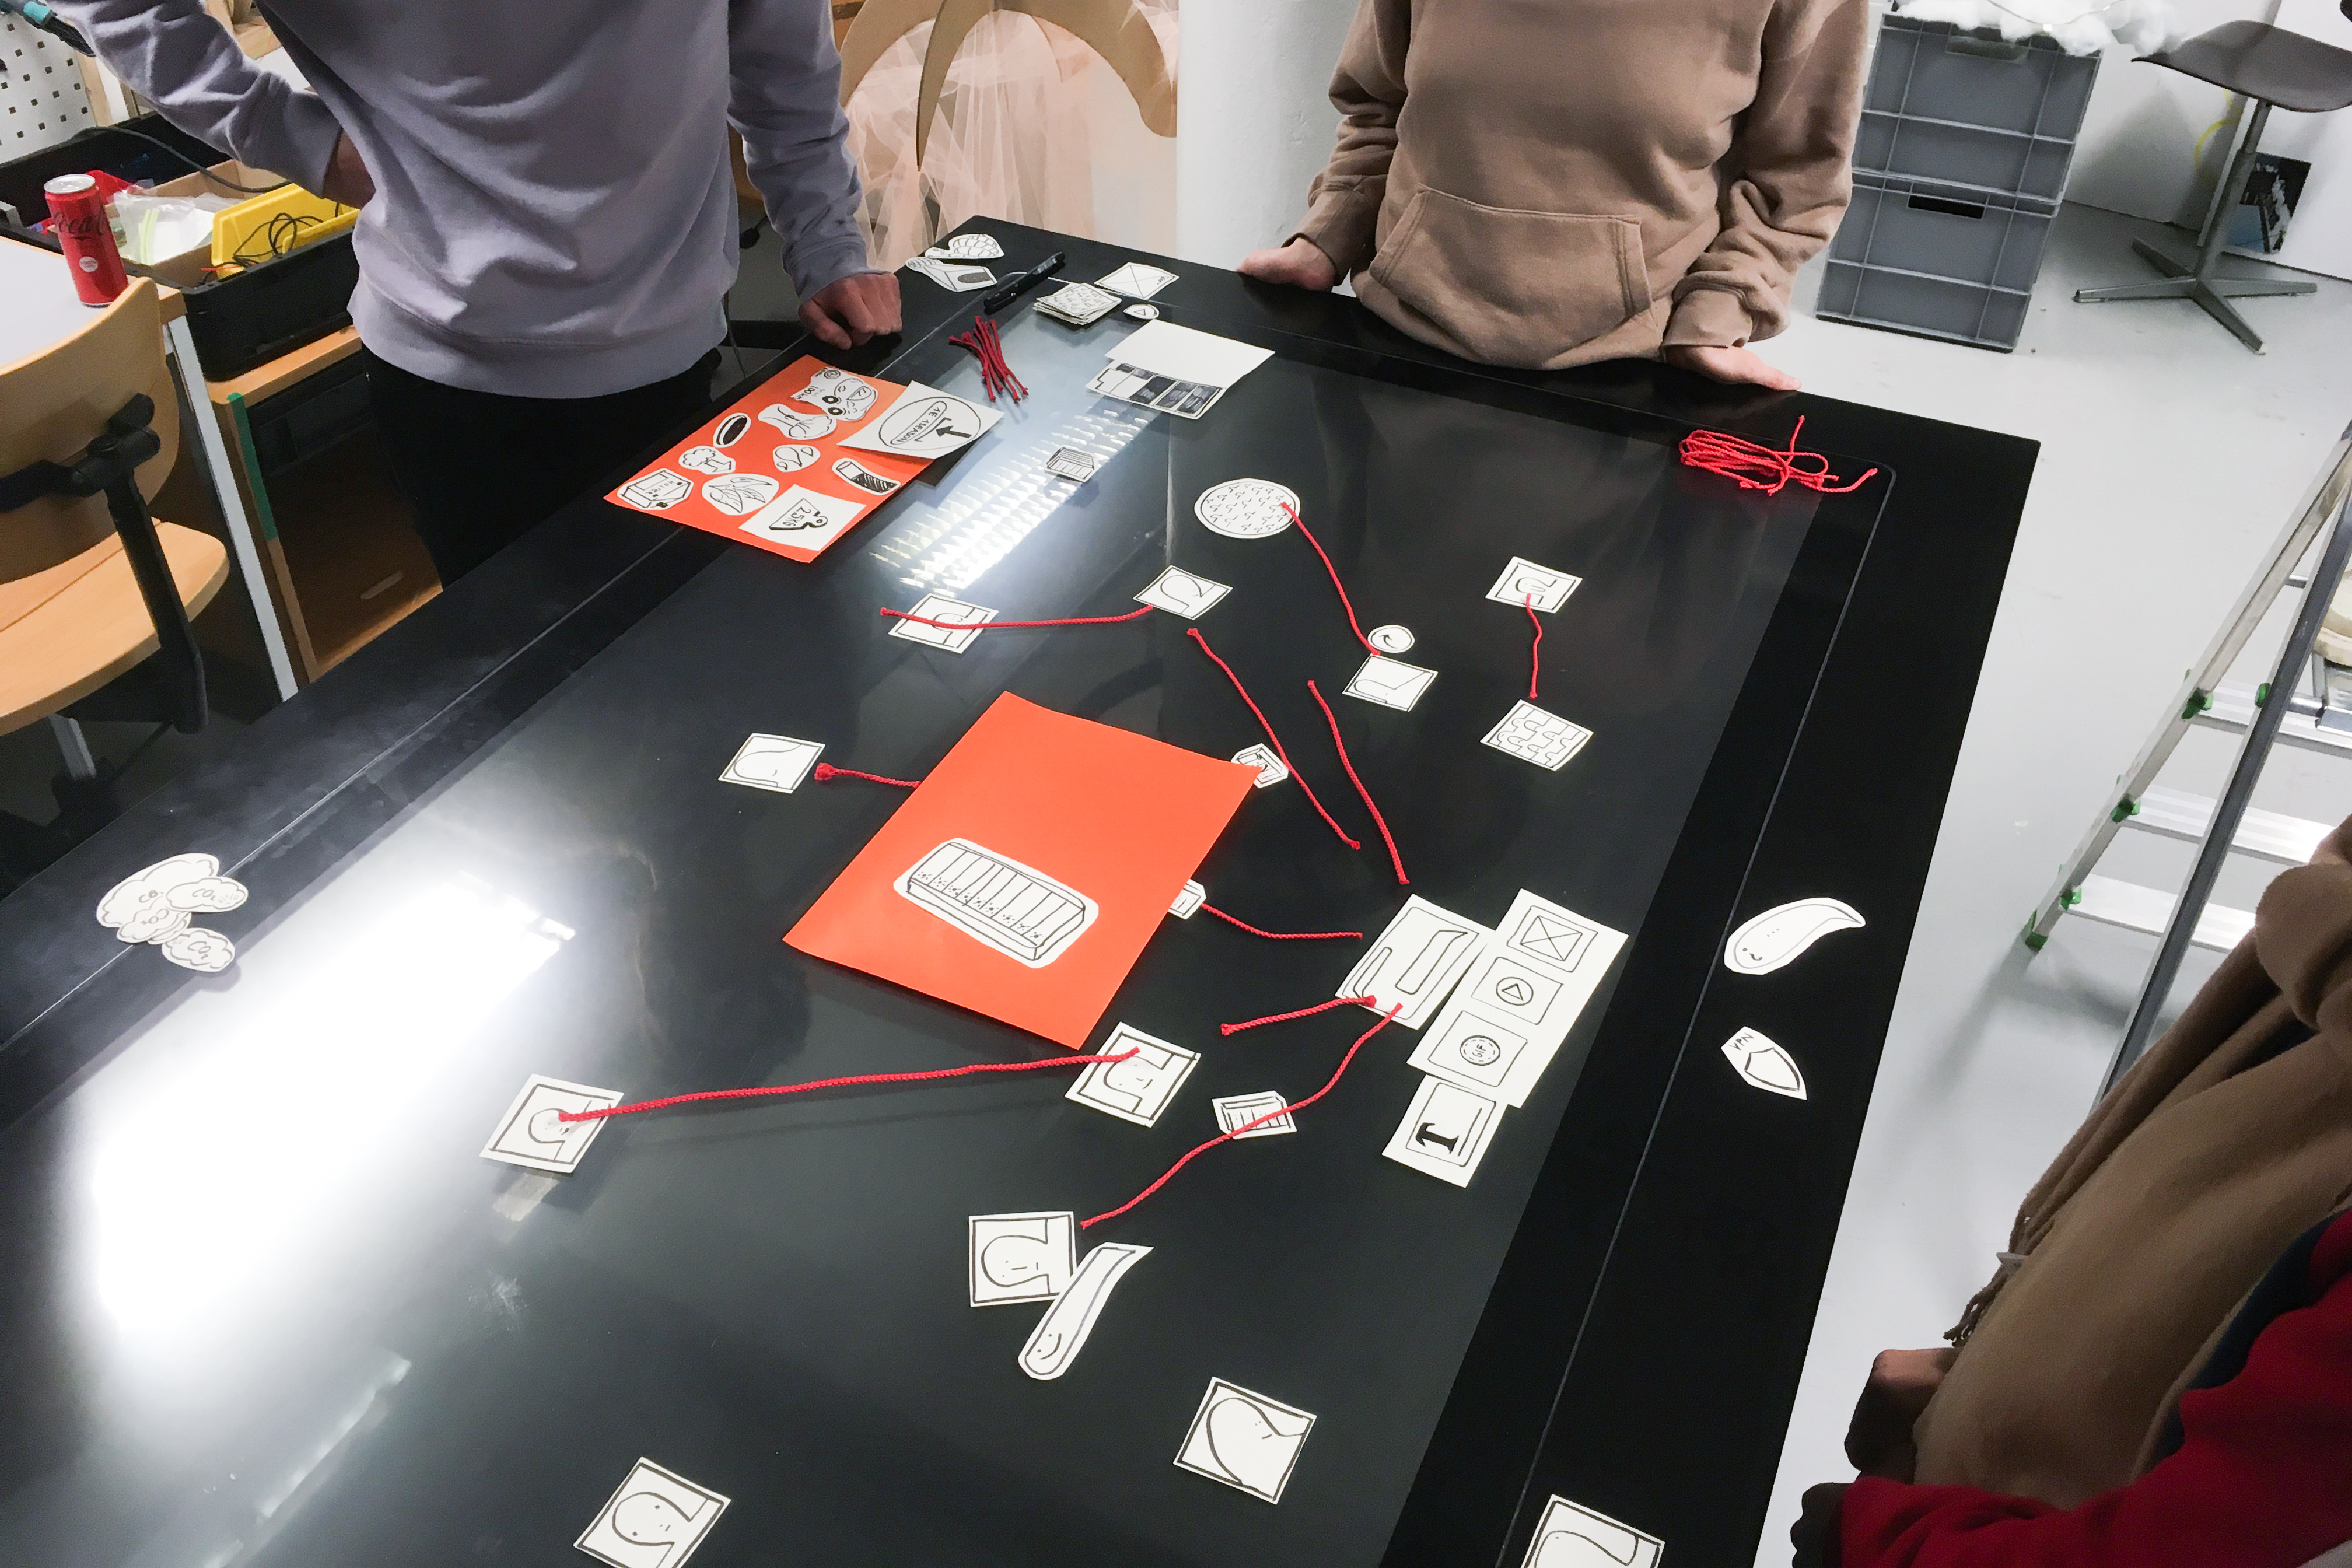
-
Atelier Visit
-
Mid Presentations
Each group has 15 minutes to present their project. Additional we have 10 minutes each for questions and feedback.
We recommend to work with slides. Of course, if you find a better way to present your project, you are free to do so.
Expectation:
- Briefly outline the most important points of the process in order to be able to understand the decision
- Concept explained on the basis of a wireframe. From the beginning (user arrives at table) to the end (user leaves table)
- Tokens interaction: What can be influenced with them?
- Refinement of the first digital visualizations
-
-
-
Interactive Touch-Table
Start prototyping on the interactive touch-table which is located in the IAD projectroom 4.K22-1
-
Programming Mentoring on request with Paulina on 22.11.22, 13:00 - 16:00
Write Paulina an email to paulina.zybinska@zhdk.ch 1 day in advance until 17:00.
-
Mentorings Tuesday
Look at the calendar for your timeslot. If someone is unable to attend a meeting, please swap the timeslots among the class so that there are no gaps.
Expectation:
We expect the core screens of the digital visualizations to be prototype click dummies that can be tried out on the interactive touch table (doesn't need to be programmed). Further bring an initial mood board for the design.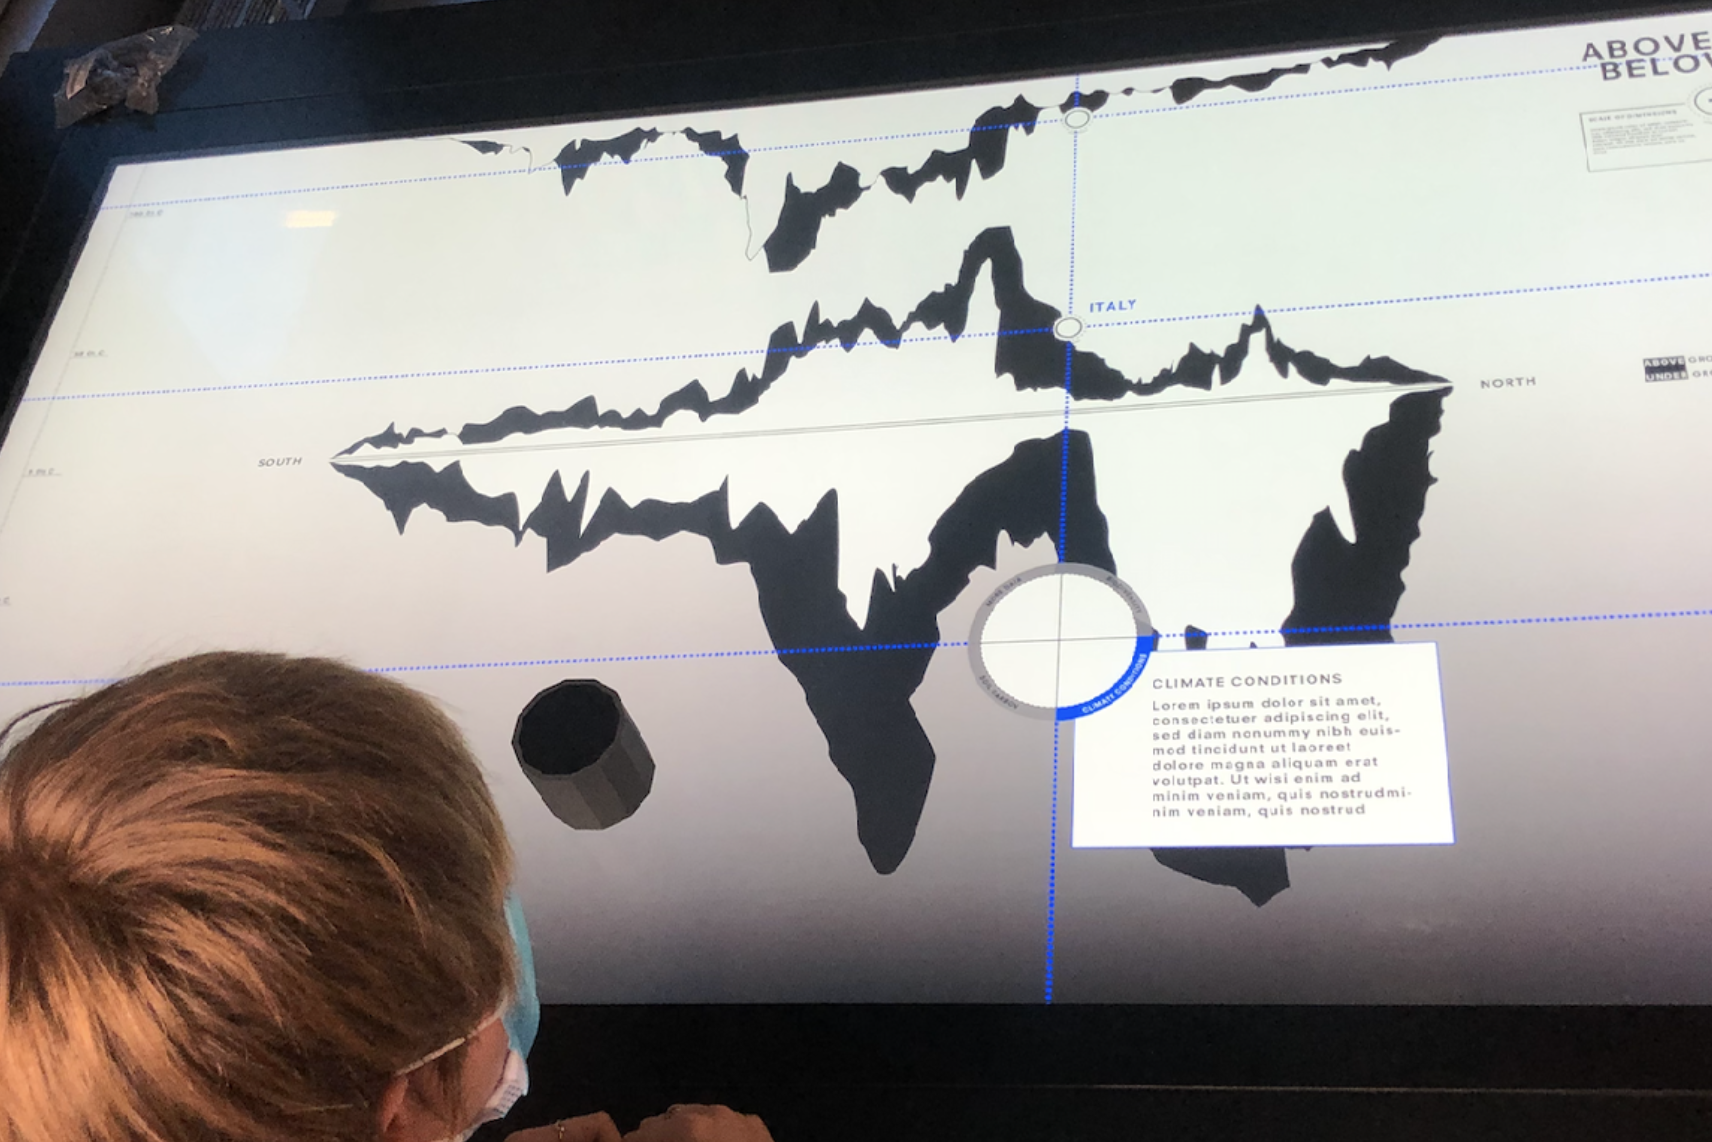
-
Mentorings on request Thursday
Write us an email to juergen.spaeth@zhdk.ch & marcial.koch@zhdk.ch 1 day in advance until 17:00.
-
Mentorings Friday
Look at the calendar for your timeslot. If someone is unable to attend a meeting, please swap the timeslots among the class so that there are no gaps.
Expectation:
We expect the incorporation of the critique from the last mentoring. Refine the existing prototype and show us the whole concept visualized on the interactive touch-table. Apply designs to your corescreens, in relation to you moodboard. Create variations.
Every function must be clear from your side. Make one corescreen interactive.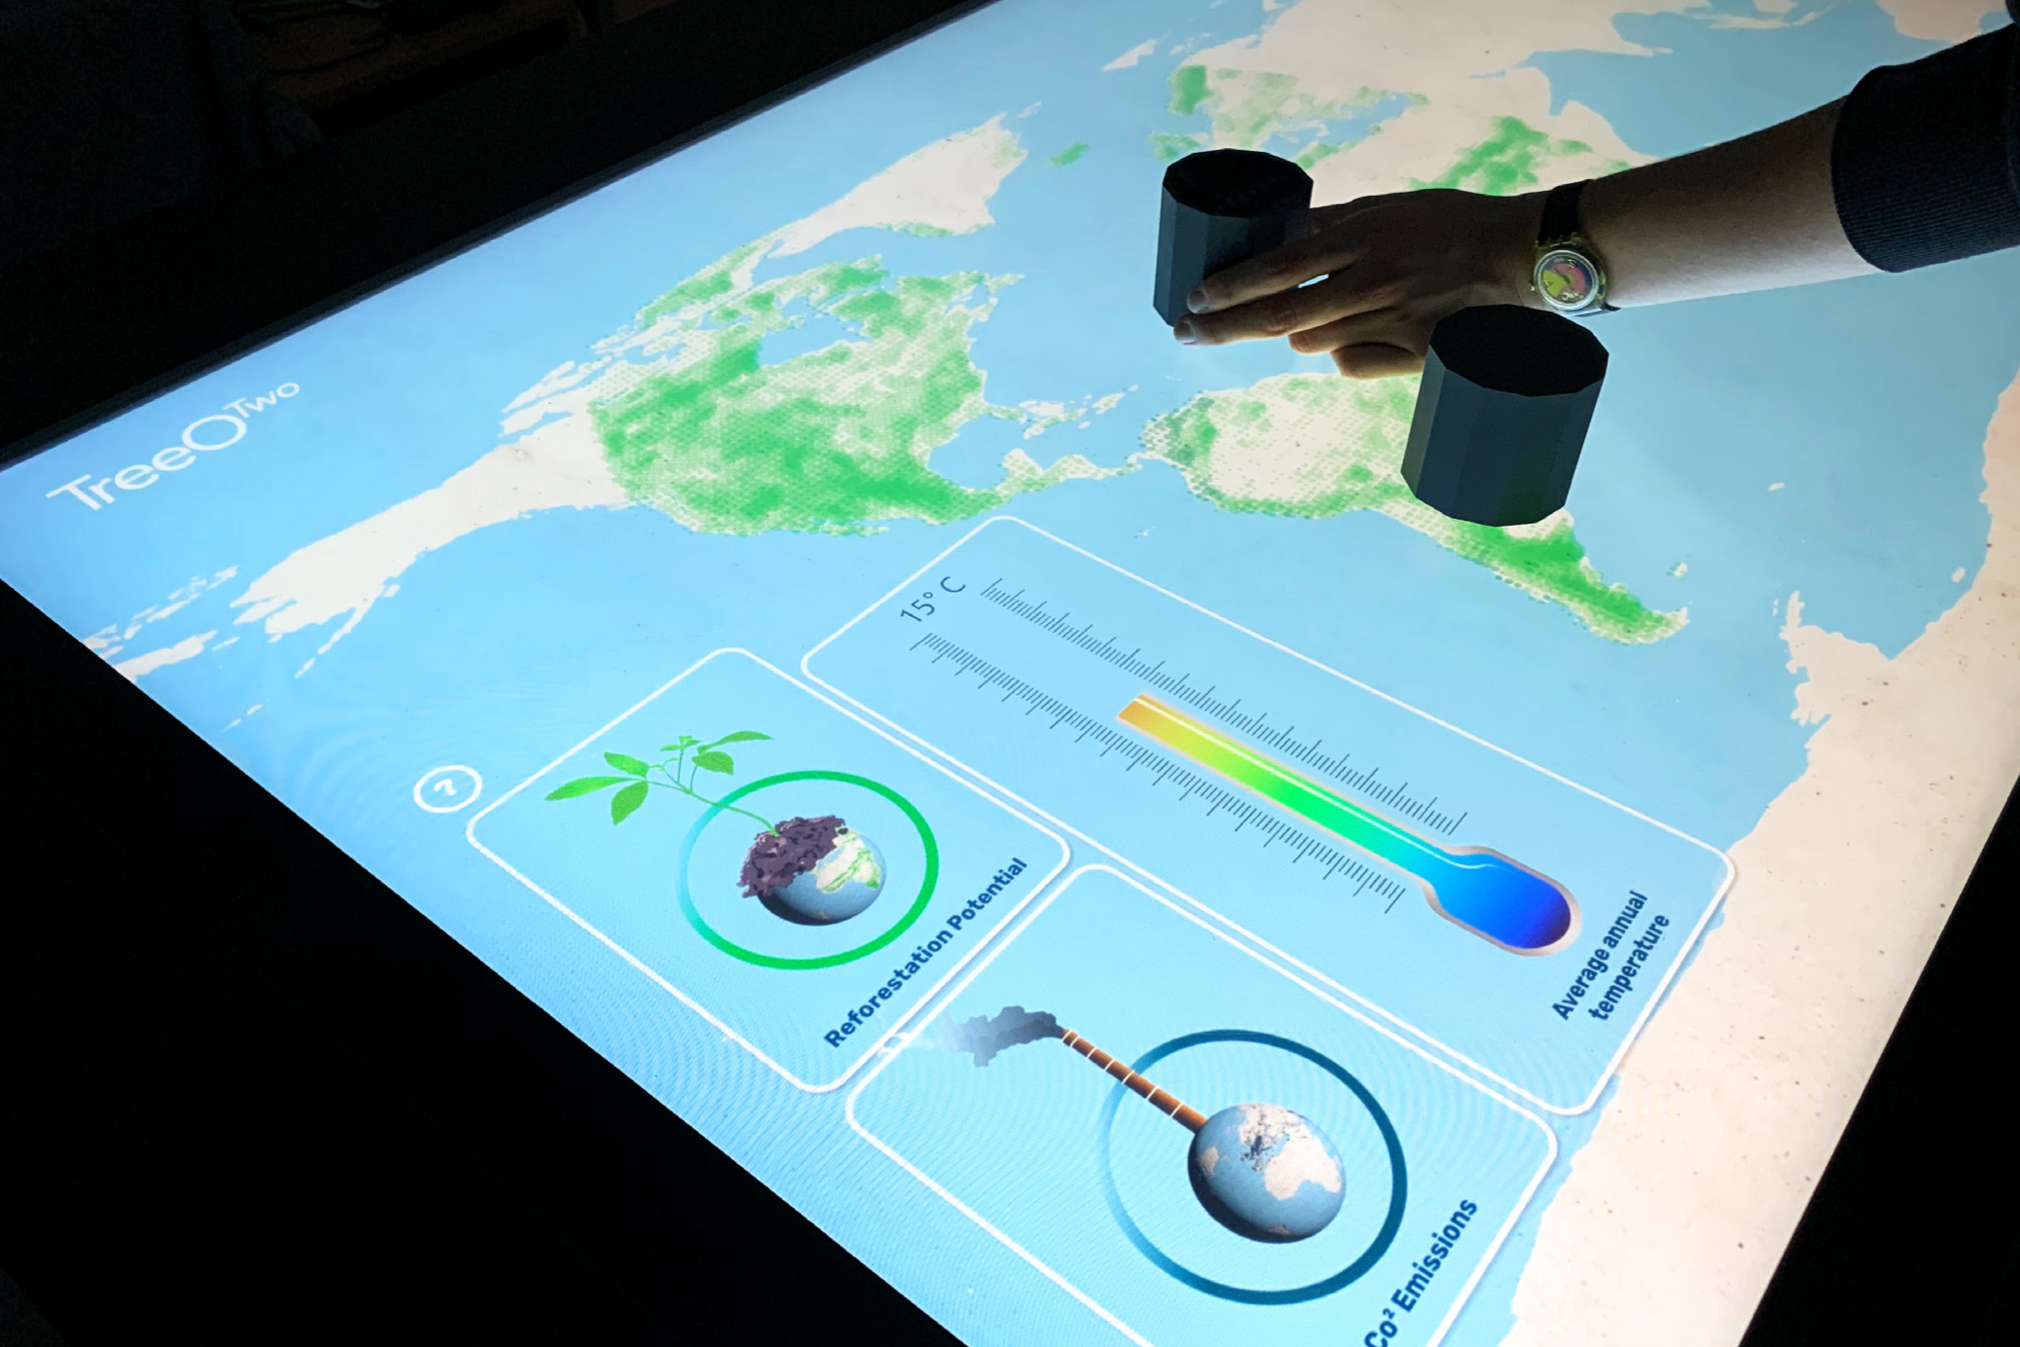
-
Programming Mentoring on request with Paulina on 25.11.22, 09:00 - 11:00
Write Paulina an email to paulina.zybinska@zhdk.ch 1 day in advance until 17:00.
-
-
Week 4 | 28.11. – 01.12.22
Hervorgehoben-
Programming Mentoring on request with Paulina on 29.11.22, 13:00 - 16:00
Write Paulina an email to paulina.zybinska@zhdk.ch 1 day in advance until 17:00.
-
Mentorings Tuesday
Look at the calendar for your timeslot. If someone is unable to attend a meeting, please swap the timeslots among the class so that there are no gaps.
Expectation:
We expect the incorporation of the critique from the last mentoring. Focus on a design and apply it to all screens. Refine the prototype. The parts which are only understandable in interaction should also run interactively. -
Programming Mentoring on request with Paulina on 30.11.22, 09:00 - 17:00
Write Paulina an email to paulina.zybinska@zhdk.ch 1 day in advance until 17:00.
-
Mentorings on request Wednesday
Write us an email to juergen.spaeth@zhdk.ch & marcial.koch@zhdk.ch 1 day in advance until 17:00.
-
Final Presentation
Each group has 15 minutes to present their project and 5 minutes for a live prototype show, where you explain your visualization. Afterwards we have 10 minutes each for questions and feedback.
We recommend to work with slides. Of course, if you find a better way to present your project, you are free to do soThe presentation should be structured as follows:
- 15 minutes presentation, show us the process, findings, concept and future steps
- 5 minutes live prototype on touch table, where you explain your visualization
- 10 minutes Q/A
-
Final Deliverables on 12.12.22, 09:00
Have a look in the course settings.
-
-
In this area you will find interesting material on «Crowther Lab» that we have collected for the course.
-
Websites
-
An open data platform of ecological insights for the global restoration movement. Coming 2021.
Founded by Crowther Lab
Supported by Google
-
Articles
-
We encourage you to do a search for the word “Forest” or “Tree” to access relevant information and not have to read the full documents.
-
Videos
-
Podcasts
-
BBC (05.07.19)
-
Datasets
-
-
In this area you will find interesting material on «Information Visualization» that we have collected for the course.
-
Websites
-
Books
-
Edward Tufte (1983)
-
Tamara Munzner (2014)
-
Riccardo Mazza (2009)
-
Alberto Cairo (2012)
-
Jacques Bertin (1983)
-
Manuel Lima (2011)
-
Tamara Munzner (2014)
-
Veruschka Götz, Anna Rigamonti (2015)
-
Papers / Readings
-
Nathan Shedroff (1999)
-
Videos
-
The original video (1980) describing the first focus+context technique, the Bifocal Display (aka Fisheye lens)
-
In this area you will find interesting material and data on «climate» that we have collected for the course.
-
Links
Making Changes that Matter – These 16 steps are the most effective way to reduce your carbon pollution and persuade others to do the same.
Act Now! – The UN Campaign for Individual Action
-
Links Databases
statista – ZHdK Campus Lizenz
Energy-related CO2 emissions per capita worldwide – statista
Distribution of energy-related CO2 emissions worldwide by sector – statista
World population – data.worldbank.org
CO2 Emissions – climatewatchdata.org
CO2 emissions by selected countries worldwide – Carbon Interface
Biodiversity Hotspots – resourcewatch.org
World Air Quality – IQ>Air
World Air Quality – getambee
Pollen information including species, plants and indices for a specific location – Breezometer
Access to high-quality weather, climate and environmental data – Planet OS
-
-
-
Data Visualisation 2022
-
Data Visualisation 2021
-
Data Visualisation 2020
-
Data Visualisation 2019
-
IAD Past
-
General Touchtable Projects
-
-
In this area you will find interesting material on «Interface Design» that we have collected for the course.
-
In this area you have the opportunity to give feedback on the entire course. Feedback welcome.
-
-