I have chosen this image because while I was looking for an example of what to avoid according to Edward Tufte, it seemed to check off every point.
Graphical Excellence:
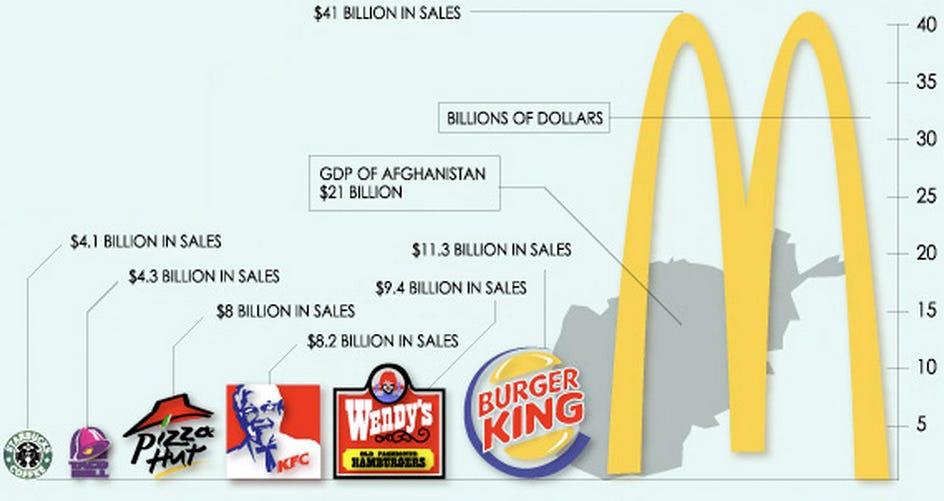
The whole visualization is hard to digest. - This image has gone for decorative icons instead of simple text. The icons add no value and all of the extra colors also make it more confusing than it needs to be. They have written «billions of sales» 7 times, when they could have written it once on the scale and only shown the numbers changing. The texts are not in a row, they are randomly hovering close their icon.
Visual Integrity:
The data is not portrayed proportionately and seems distorted. - As the author of the post, where I found this image, has commented, I quote “Burger King has 3 times as much in sales than Starbucks. It makes sense that it's three times taller. But the fact that its area is nine times that of Starbucks shows why this chart exemplifies everything that is wrong with charts that try to incorporate cutesy graphics.” The Afghanistan icon is also hidden behind the MacDonald’s icon for some reason and so it is not shown as an equal piece, compared to the other icons.
Maximizing the Data-Ink Ratio:
100% ink, not much data. - The whole image is full of ink and the data shown is minimal. They have added an unnecessary background. They included the GDP of Afghanistan and a large picture, which seems to have nothing to do with the other data. If it is for context, why specifically Afghanistan and not a different country? Or multiple counties? If they had left out the 7 «billions of sales» the numbers would fit in a row over the icons (which could have been words or abbreviations) and they wouldn’t have to do the lines, which also use up ink. By making circles or points on a coordinate system, they could have reduced the size and gotten rid of the icons. Or if they wanted to do it like this, the scale from 5-40 and the text “billions of dollars” is also unnecessary, because write the amount over each picture anyway.
Aesthetic Elegance:
Almost no elegance - The whole visualisation is unnecessarily complicated. It isn’t visually appealing and neither is it very organised, the order from least to most sales is about the only thing. Everything seems clash and is quite jumbled together.